
#> Simple feature collection with 6 features and 18 fields
#> Geometry type: MULTIPOLYGON
#> Dimension:     XY
#> Bounding box:  xmin: 749383.6 ymin: 2913059 xmax: 801174.4 ymax: 2965741
#> Projected CRS: NAD83 / Massachusetts Mainland (ftUS)
#> # A tibble: 6 × 19
#>   grid_id land_area canopy_gain canopy_loss canopy_no_change canopy_area_2014
#>   <chr>       <dbl>       <dbl>       <dbl>            <dbl>            <dbl>
#> 1 AB-4      795045.      15323.       3126.           53676.           56802.
#> 2 I-33      265813.       8849.      11795.           78677.           90472.
#> 3 AO-9      270153        6187.       1184.           26930.           28114.
#> 4 H-10     2691490.      73098.      80362.          345823.          426185.
#> 5 V-7       107890.        219.       3612.             240.            3852.
#> 6 Q-22     2648089.     122211.     154236.         1026632.         1180868.
#> # ℹ 13 more variables: canopy_area_2019 <dbl>, change_canopy_area <dbl>,
#> #   change_canopy_percentage <dbl>, canopy_percentage_2014 <dbl>,
#> #   canopy_percentage_2019 <dbl>, change_canopy_absolute <dbl>,
#> #   mean_temp_morning <dbl>, mean_temp_evening <dbl>, mean_temp <dbl>,
#> #   mean_heat_index_morning <dbl>, mean_heat_index_evening <dbl>,
#> # mean_heat_index <dbl>, geometry <MULTIPOLYGON [US_survey_foot]>spatialsample:
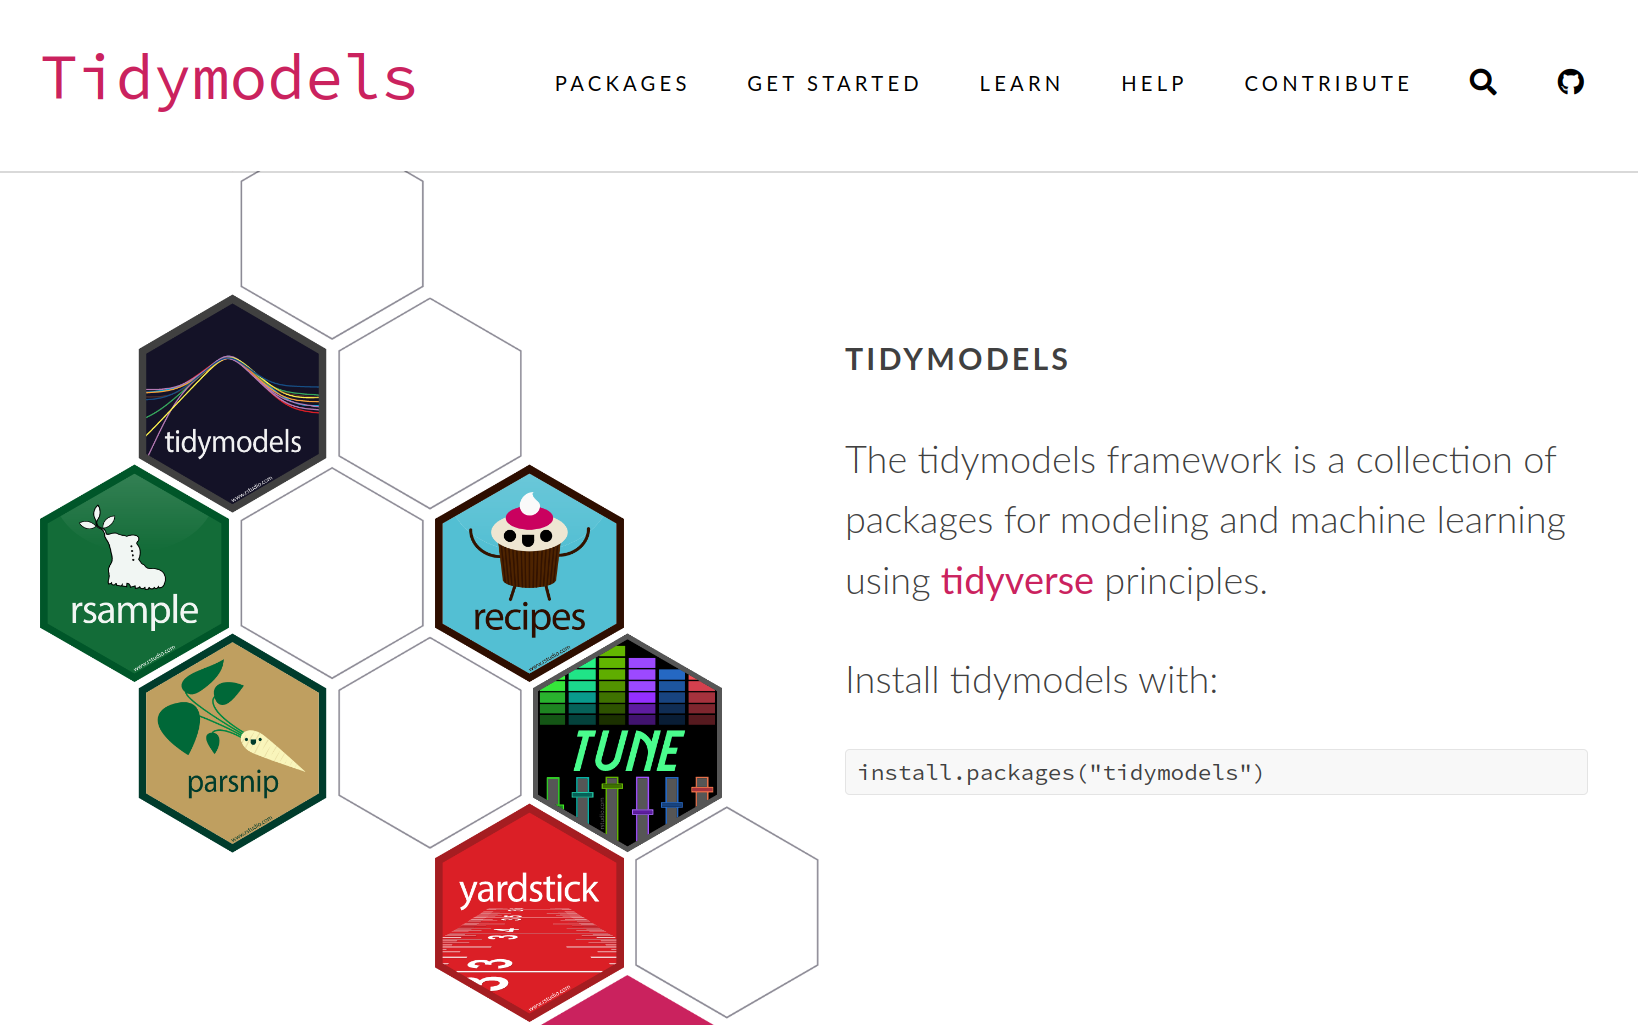
A tidy approach to spatial cross-validation
About Me
Mike Mahoney
PhD candidate in environmental science
Research assistant, CAFRI
Past: Posit (formerly RStudio), Permian Global
These slides: mm218.dev/ehadec2023

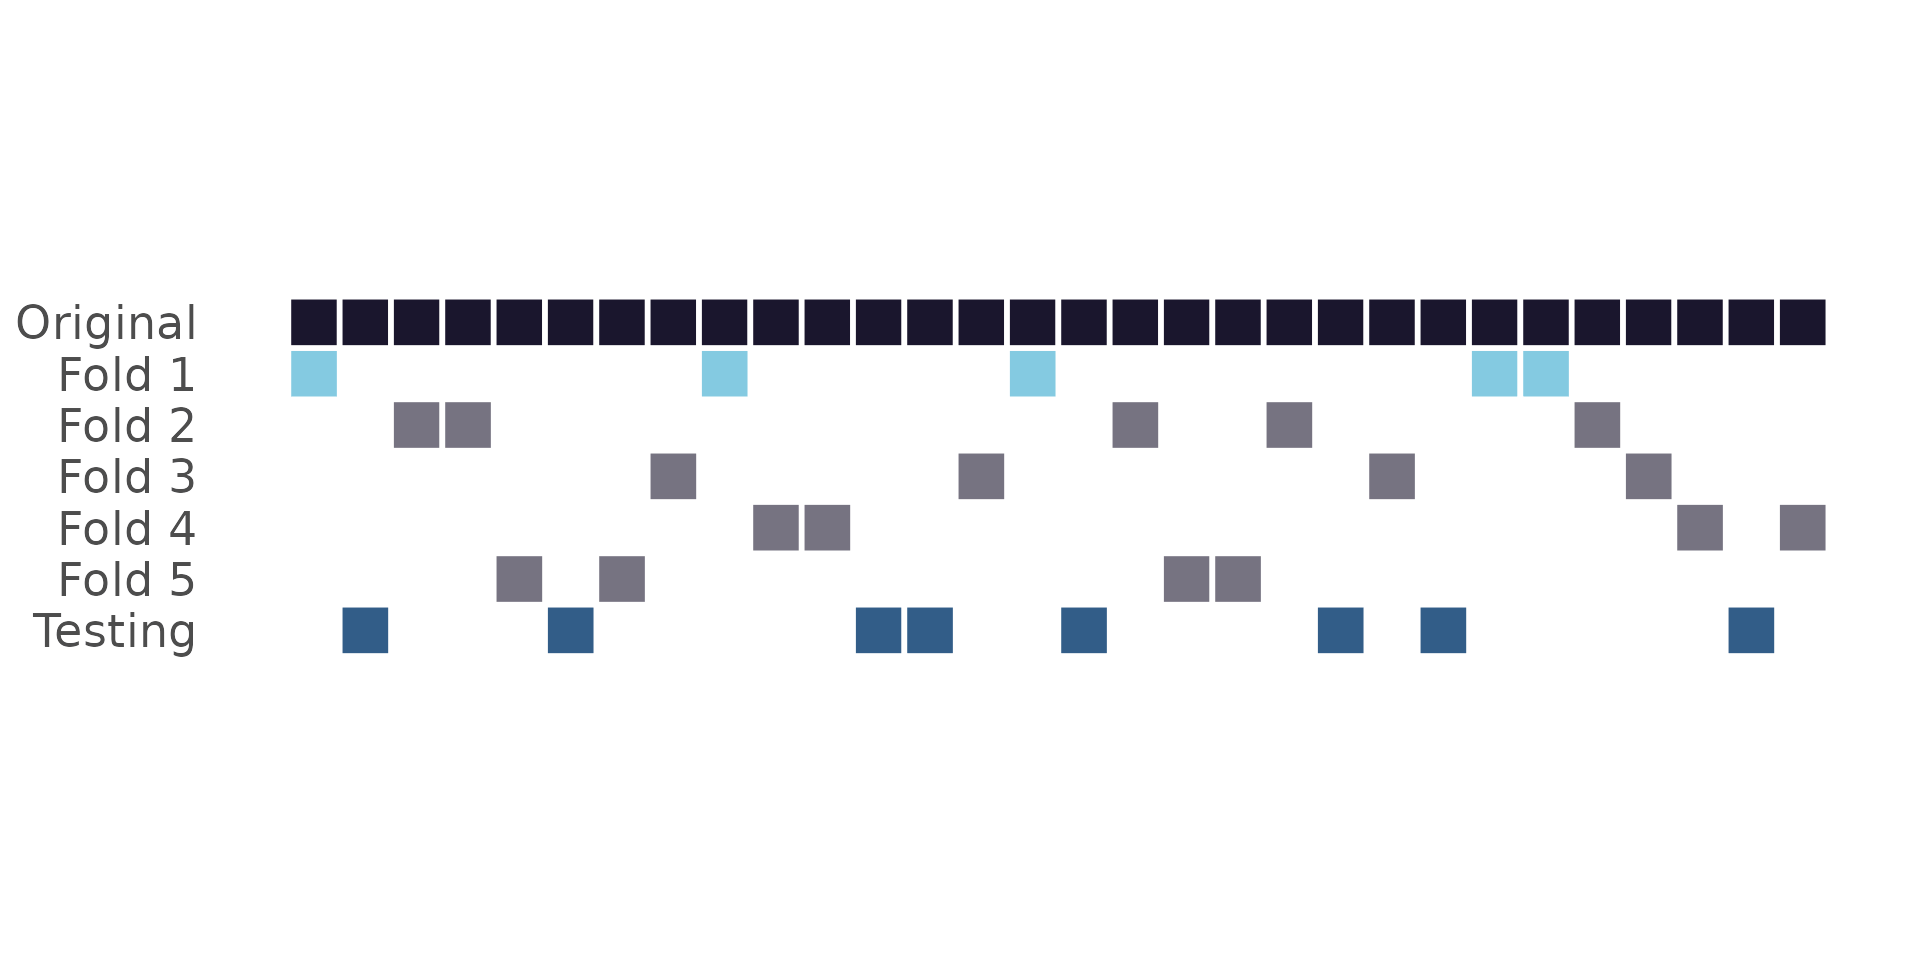
Data splitting:


Cross-validation:
What does “new data” mean?

Are these folds really unrelated?


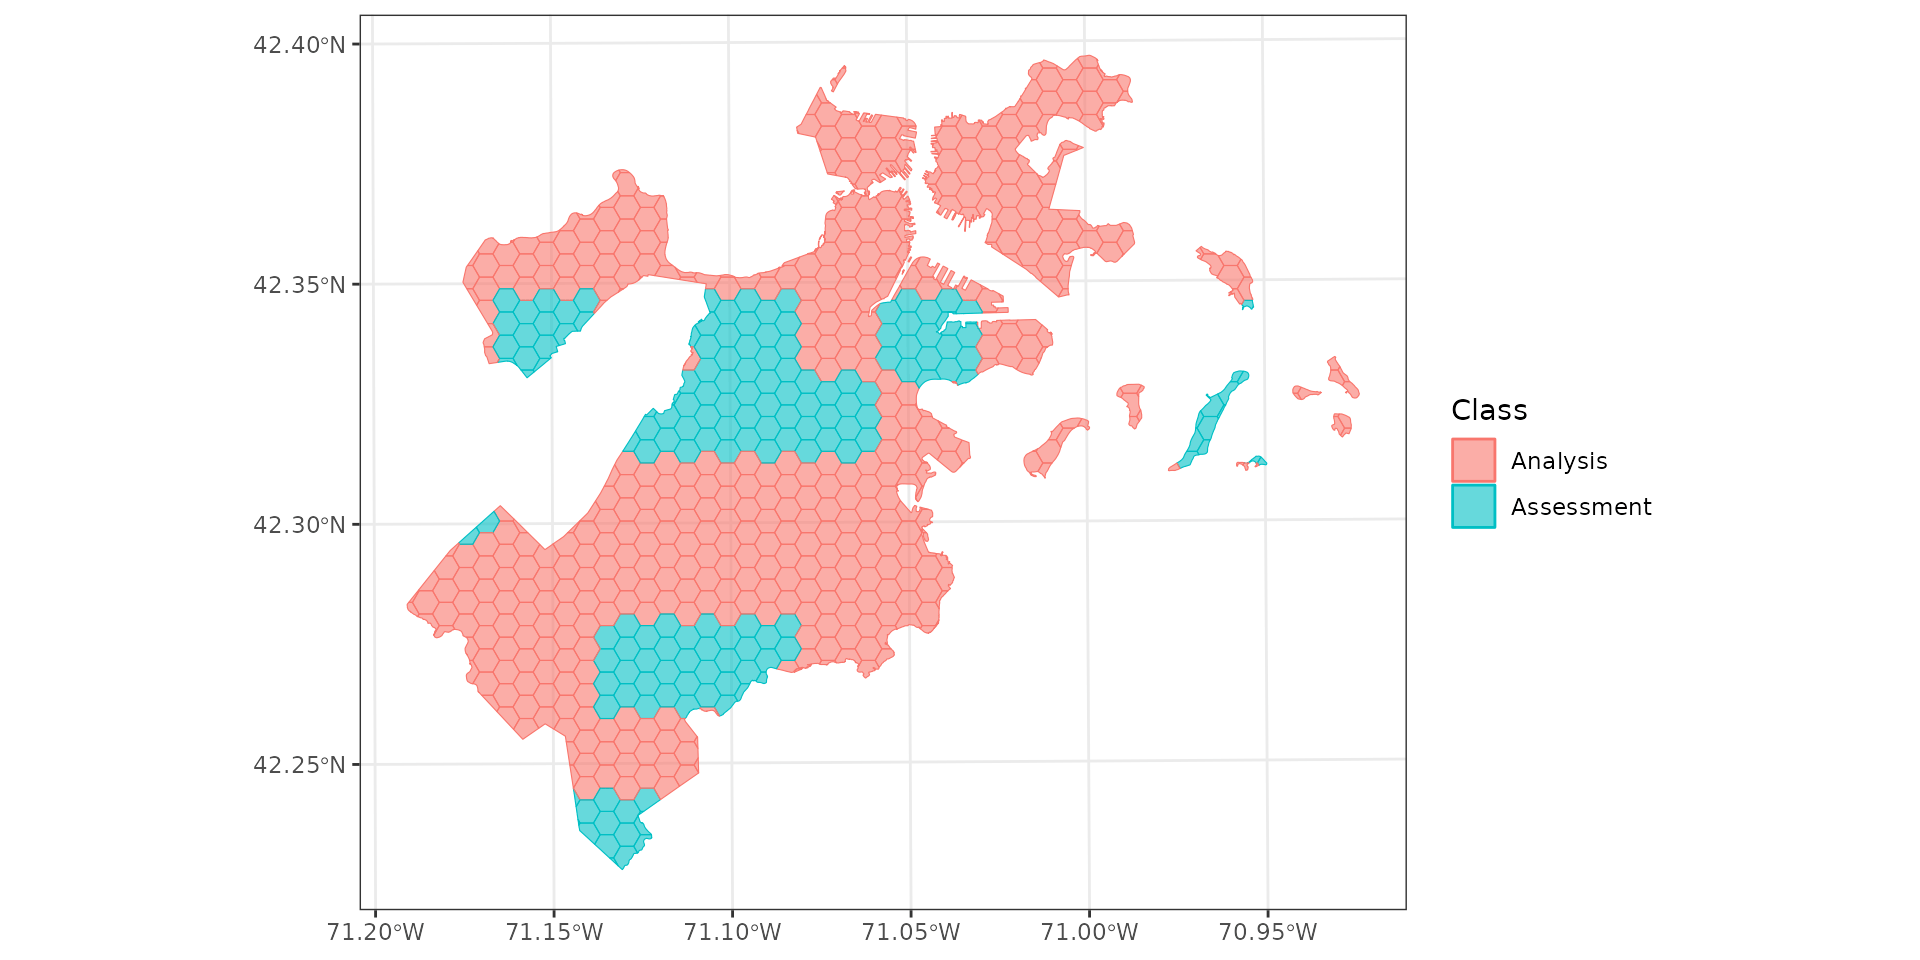
Spatial clustering

Spatial clustering
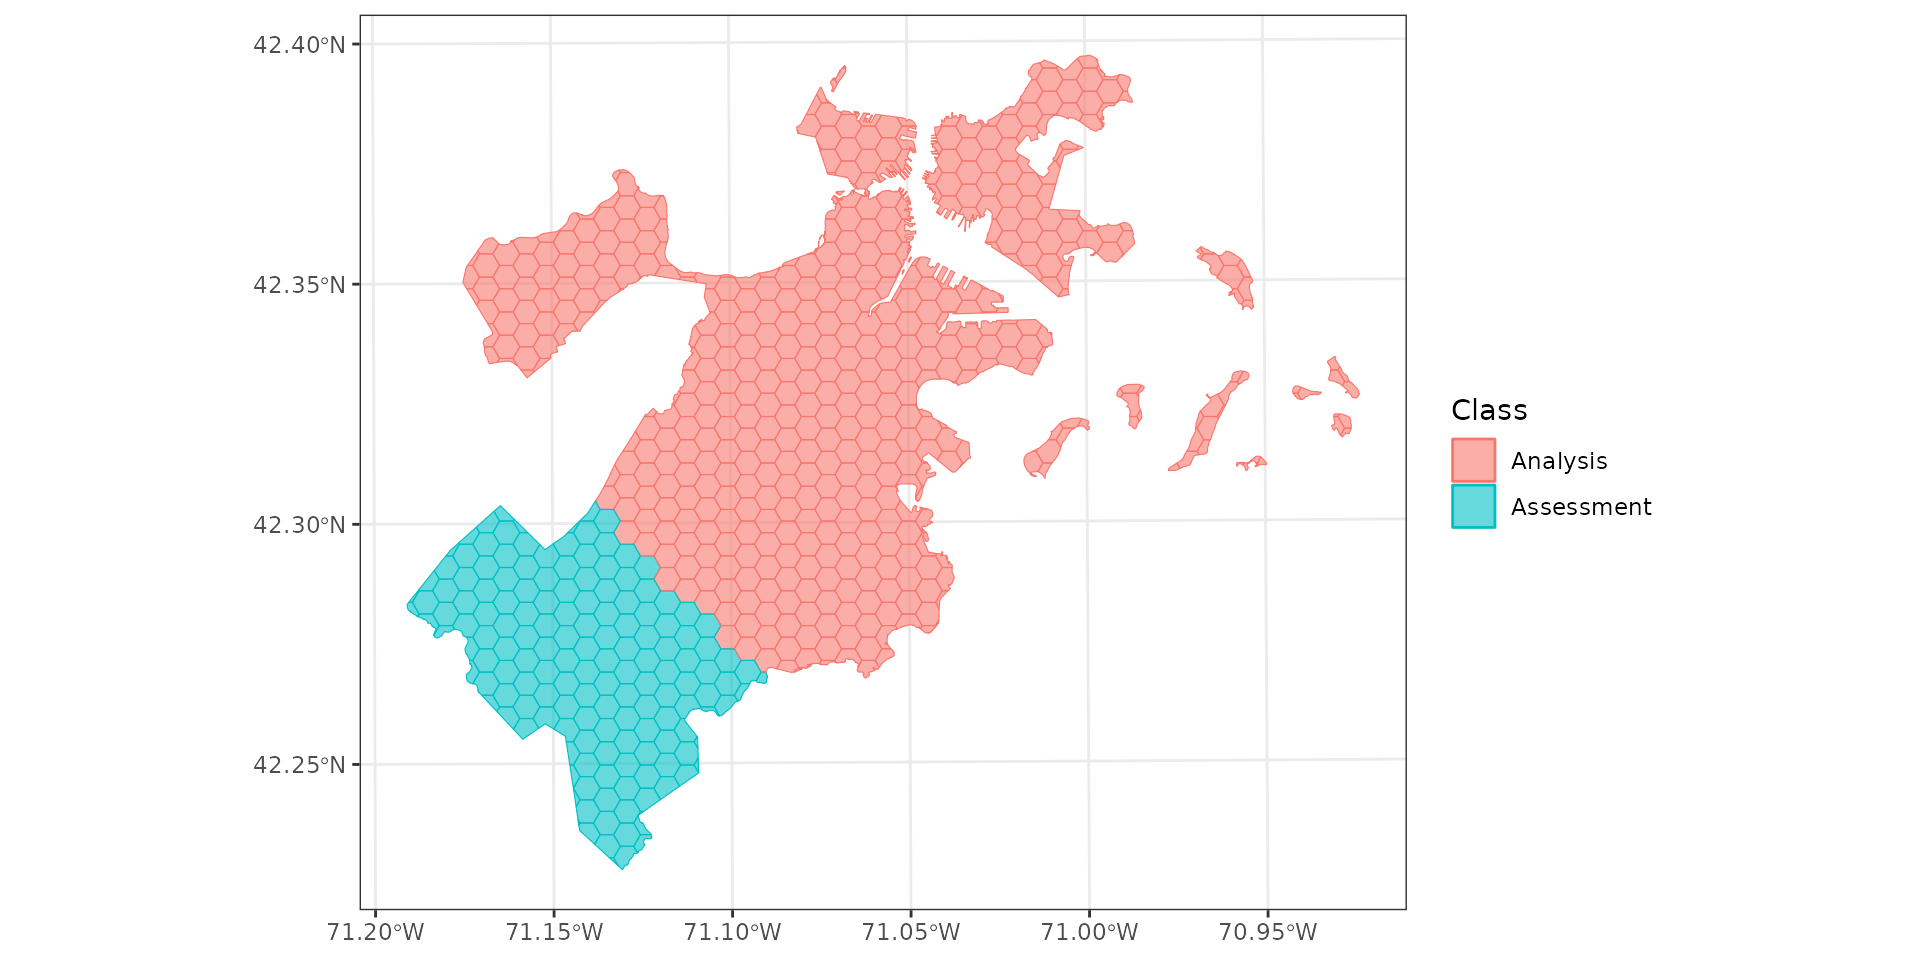
Spatial blocking

Spatial blocking
Spatial blocking

Spatial LODO
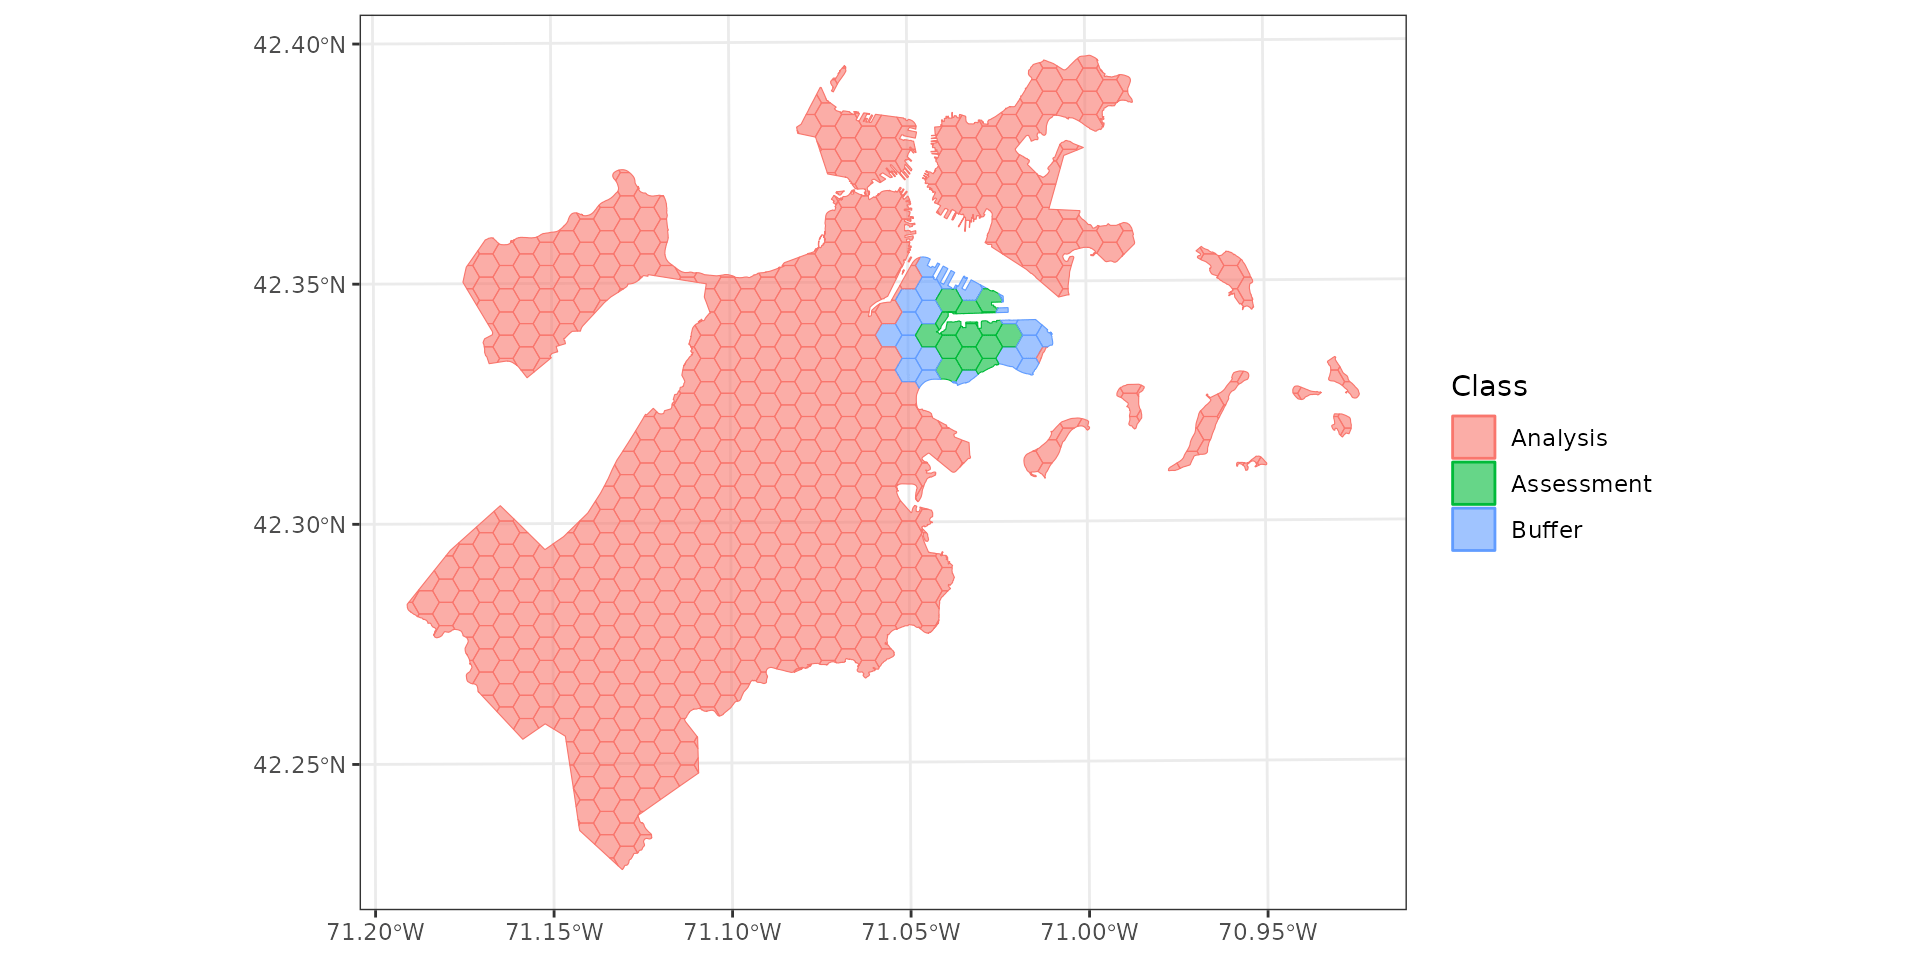
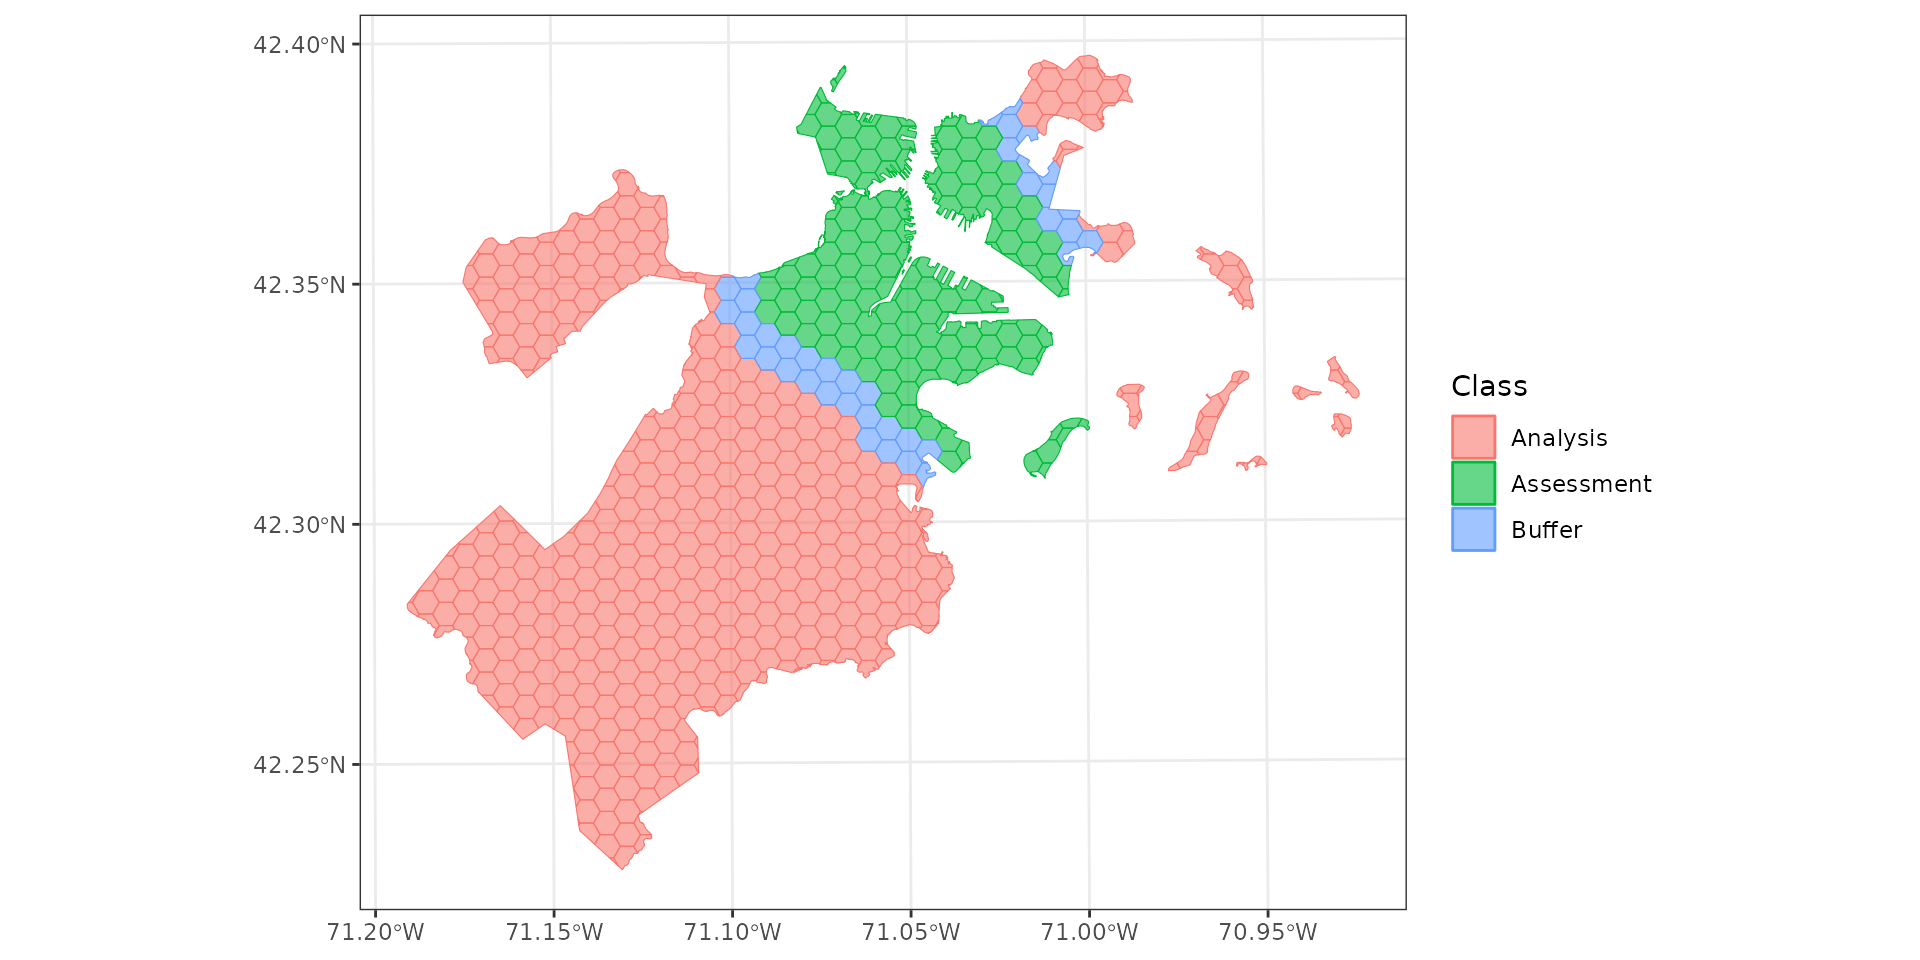
Buffering
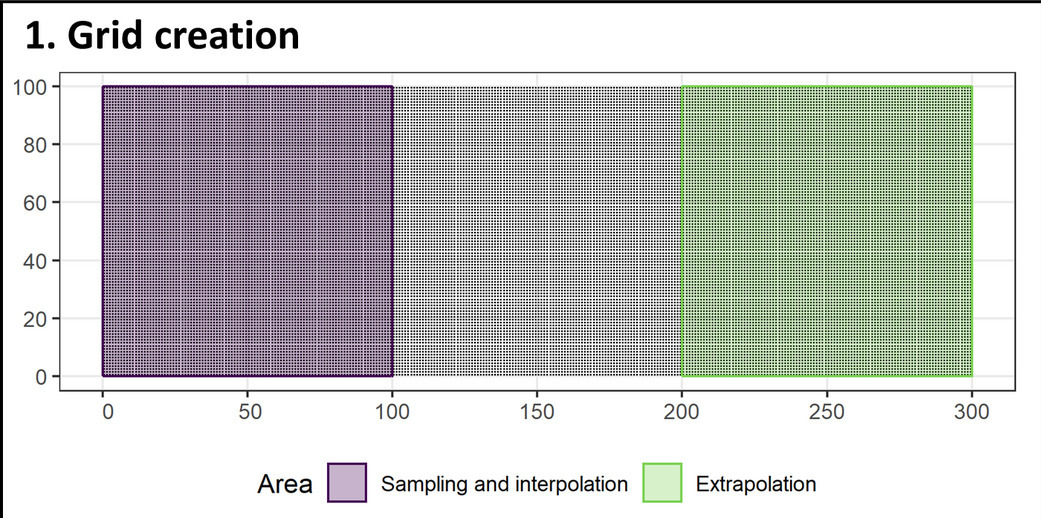
Should we be doing this at all?

Should we be doing this at all?

Should we be doing this at all?
Should we be doing this at all?
From Mila et al. (2022). “Nearest neighbour distance matching Leave-One-Out Cross-Validation for map validation”. Methods in Ecology and Evolution 13(6), pp 1304-1316. doi: 10.1111/2041-210X.13851.